Richest Counties in Washington (2026)
by Kristen Carney
Updated: February 9, 2026
Richest County in Washington
The richest county in Washington is King County with an average household income of $176,799 as of 2024 and 2,287,171 people as of 2024 according to the most current Census data available (citation).
| Rank | County | Population | Average Income | Median Income |
|---|---|---|---|---|
| 1 | King County | 2,287,171 | $176,799 | $124,746 |
| 2 | Snohomish County | 844,430 | $142,821 | $111,246 |
| 3 | Kitsap County | 277,881 | $132,745 | $104,158 |
| 4 | San Juan County | 18,478 | $131,031 | $84,800 |
| 5 | Clark County | 516,959 | $125,385 | $97,536 |
| 6 | Pierce County | 930,319 | $124,488 | $99,564 |
| 7 | Skamania County | 12,402 | $114,147 | $93,265 |
| 8 | Thurston County | 299,067 | $114,140 | $96,563 |
| 9 | Benton County | 212,905 | $113,863 | $89,874 |
| 10 | Island County | 86,836 | $113,035 | $90,551 |
| 11 | Chelan County | 80,172 | $112,869 | $82,381 |
| 12 | Skagit County | 131,328 | $111,733 | $89,263 |
| 13 | Douglas County | 44,366 | $109,623 | $80,363 |
| 14 | Whatcom County | 230,503 | $109,592 | $81,784 |
| 15 | Franklin County | 98,902 | $109,166 | $86,714 |
| 16 | Jefferson County | 33,577 | $104,756 | $74,048 |
| 17 | Spokane County | 549,056 | $103,315 | $78,582 |
| 18 | Kittitas County | 47,172 | $102,663 | $73,804 |
| 19 | Mason County | 67,982 | $100,630 | $83,270 |
| 20 | Walla Walla County | 62,161 | $98,236 | $74,202 |
Median Income versus Average Income: Which Should You Use?
We usually suggest using median income data – either instead of or in addition to – average income data as a true indicator of wealth. If you haven’t thought about median versus average since your last standardized test, you aren’t alone. Here’s what they are:
- average is the sum of a set of numbers divided by the count of numbers in the set
- median is the middle number in the set of numbers
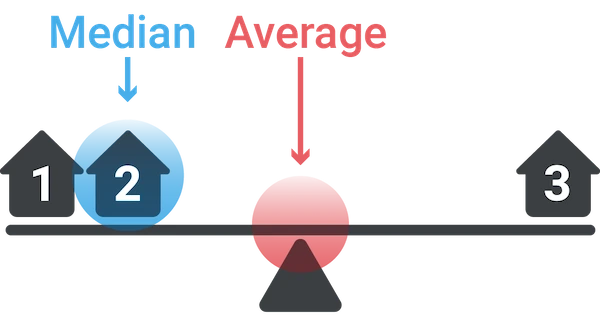
Now let’s say you had the following simplified set of income data.
Household 1: $30,000
Household 2: $50,000
Household 3: $1,000,000
The average income for this set is $360,000. The outlier data point ($1,000,000) skews the average WAY up. Conversely, the average income would be skewed WAY down if someone had an income of $500. The median income for the same data set is $50,000. Outlier data doesn’t skew the median.
Most Business Owners Should Use Median Income
So most business owners should use the median income as a true indicator of wealth, because it provides a more accurate representation of a typical income, especially in areas with significant income disparity.
When Should You Use Average Income
If your target market is high-income households, the average income may be more relevant. This is because the average income can highlight the presence of a higher concentration of wealthy individuals, which is beneficial for luxury goods and services marketing. We’re using average income on this page because using the Census’s highest reported median value of $250,001 could result in multiple ties for the richest geography.
Why do so many cities have a median value of $250,001?
The Census' American Community Survey uses $250,000+ as a jam value for median income estimates to protect privacy, ensure data consistency, and simplify reporting. A "jam value" in survey data refers to a placeholder or default value used when actual data points are unavailable, incomplete, or exceed certain thresholds. We represent this jam value as $250,001 to make it easy for you to sort.
You might also be interested in:
Email Me When New Data Are Released
Join thousands of subscribers and receive just 1 (ONE!) email a year in December when the US Census Bureau releases new income data for Washington richest counties.
SOURCES
United States Census Bureau. Annual Estimates of the Resident Population: April 1, 2020 to July 1, 2024. U.S. Census Bureau, Population Division. Web. May 2025. http://www.census.gov/.
United States Census Bureau. B01001 SEX BY AGE, 2024 American Community Survey 5-Year Estimates. U.S. Census Bureau, American Community Survey Office. Web. 29 January 2026. http://www.census.gov/.
United States Census Bureau. B19013 Median Household Income, 2024 American Community Survey 5-Year Estimates. U.S. Census Bureau, American Community Survey Office. Web. 29 January 2026. http://www.census.gov/.
United States Census Bureau. “DP03 SELECTED ECONOMIC CHARACTERISTICS.” 2024 American Community Survey 5-Year Estimates. U.S. Census Bureau, American Community Survey Office. Web. 29 January 2026. http://www.census.gov/.
Products & Services
Plumbing
Connect
- 1-800-939-2130
- Contact Us
© Copyright 2026 Cubit Planning, Inc.